Understanding and Expanding Azure Monitor Service across the Clouds
Today we are going to discuss about Azure monitor service. It is PaaS based service. It does resource monitoring by checking its performance and availability. Monitoring data become critical to increase your visibility of Azure resource for daily operation. Your resource could be IaaS or PaaS based Applications or Services. Based on collected data over stipulated time, you can decide to take action. By doing it, you are strengthening the five pillars of architecture framework, under which you deliver the product.
As soon as you create a resources such as VMs and web apps in azure cloud, Azure Monitor starts collecting data via activity logs and standard metrics. Activity logs records all operation related tasks performed by your team through the portal and Metrics takes count of resource consumption on frequency set.
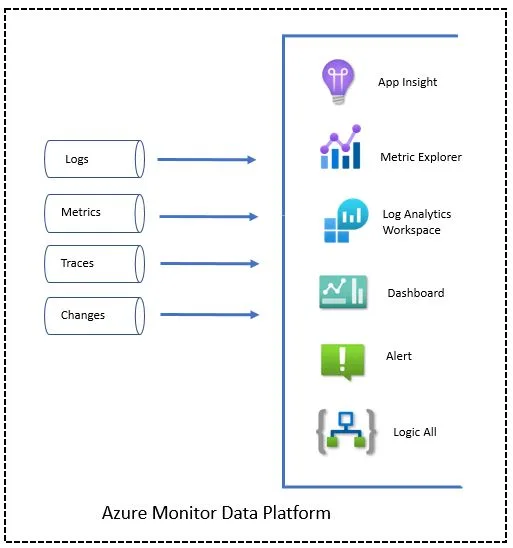
Azure monitor is capable to collect data from Application, container, Guest OS, Azure resource, subscription, tenant. This Azure monitor data platform is made up metrics, logs, traces and changes.
When you start with any Windows or Linux VM, it is recommended to enable boot diagnostic and OS guest diagnostic.
You also need to define diagnostic setting how resource logs and metrics should be collected and data can be sent. OS Diagnostic setting cover performance metric, logs, sinks (sending diagnostic data) and agent details. This setting vary from Windows to Linux. Most common use is to send them to a Log Analytics workspace so you can analyze them with Log Analytics.
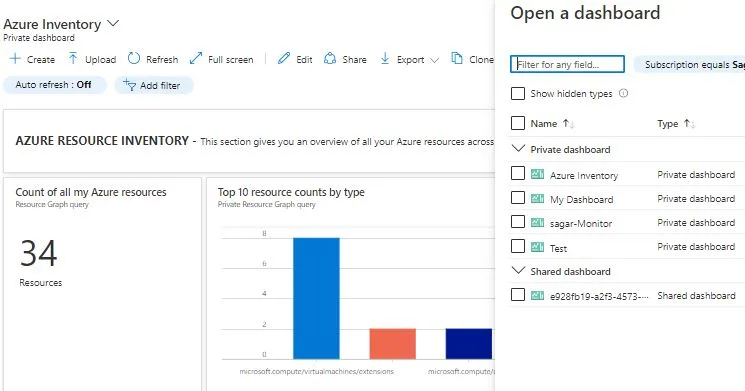
To visualize monitoring data, you can use dashboard or workbook. Your dashboard is single pane of glass which show different kind of data. Your dashboard can be private or shared. You use workbook to tap into multiple data sources from across Azure and combine them into unified interactive experiences
Understanding Azure Monitor Data Platform
Many Azure IaaS and PaaS services have a Monitoring tab, includes insights, alerts, metrics, Diagnostic settings, logs and workbook. Take a quick view of components.
- Insights – It gives better visibility of resource by collecting telemetry data. You can customize monitoring experience . This is available for VM, VMSS, Container, Network, Storage and databases. It monitors their running processes and dependencies on other resources. It is not by-default enabled, you have to enable manually. Cost will be applicable when you enable log analytics workspace. While enabling it, you have to create data collection rule (CDR) and log analytics workspace. Other than VM insights there are two more insights to look for.
- Application Insights monitors the availability, performance, and usage of your web applications
- Container insights monitors the performance of container workloads that are deployed to managed Kubernetes clusters hosted.
2. Alerts – It notify users about the critical condition of resource, application and services. It send response via text and email. Rules are based on metrics or based on logs collected. You can launch automated process that attempts to correct error condition.
3. Metrics – Use metrics explorer to investigate the health and utilization of your resources. You can select scope, naming namespace, metric and Aggregation. Metrics in Azure Monitor are stored in a time-series database. This makes metrics ideal for alerting and fast detection of issues. Metrics are numerical values that describe aspect of a system at a particular point in time. They are getting collected at regular intervals. You can opt for standard and custom metrics.
4. Logs – Events that occurred within the system. Logs in Azure Monitor are stored in a Log Analytics workspace. Azure Data Explorer which provides a powerful analysis engine and rich query language.
5. Traces – Traces are series of related events that monitors a user requests. It is nothing but API calls. They can be used to determine behavior of application code and the performance.
6. Changes – It is related with site issues, outages, component failures, or other changed data. You have to configure it manually. It provides insights into those application changes, increases observability, and reduces the mean time to repair (MTR).
Observability is prime focus of azure monitor to provides best monitoring experience to users. It’s collection of operational data from every layer and every component of the distributed system. You can perform deep insights on this data with different perspectives. Observability covers Metrics, logs, distributed traces, and changes.
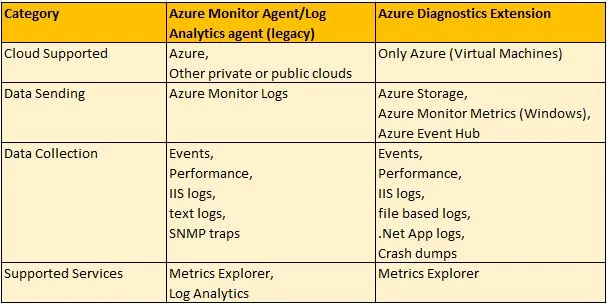
Azure Monitor agent is required for VM, VMSS and container to collect metrics, logs, application traces and changes and send to Azure monitor service.
Below Chart help you to understand what kind of details agent collects
Response To Azure Monitor Events
Every monitoring solution will be effective if it is able to proactively respond to critical conditions identified in collected data. The response in terms of sending a text or email to IT Admin, so that he/she investigate and fix it. You can also set automated process to correct an error condition and inform before IT admin take any action. Alerts in Azure Monitor proactively notify if any critical conditions occurs and capable to take corrective action. Alert can be setup at log query or on metric level.

Presenting Azure Monitor data
You use charts and tables to prepare the report for different stakeholders in your company. You can use dashboard and workbook for this purpose.
Azure dashboards allow you to combine different kinds of data into a single pane in the Azure portal. It combines tiles that show a graph of metrics, a table of activity logs, a usage chart from Application Insights, and the output of a log query. You can keep dashboard private or shared.
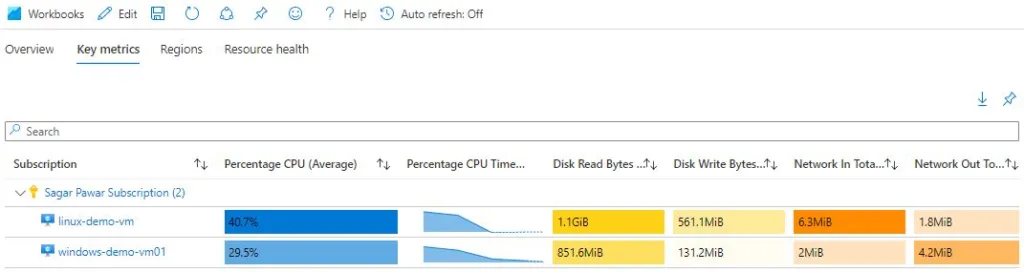
Workbooks provide a flexible canvas for data analysis and the creation of rich visual reports in the Azure portal. With Workbook, you can give unified interactive experience to customer by collecting the data. Either use available workbooks or create your own from predefined templates.
Azure Monitor Integration
You can integrate Azure monitor with azure service like event hub and logic app to build custom solution. Data can be exported to storage account for ingestion, retention and archival. APIs are available for import and export the monitoring data. Its integration is also available with APM providers, Dev Tools, Visualization tools, 3rd party Analytics, SIEM tools, Automation services and ITSM tools.
Monitoring Other Clouds
Through Azure Monitor, you can use application insight to collect traces of remote application. You can use azure monitor agent to collect guest operating system of virtual machine running in other clouds.
Security Monitoring
From Security point of view, Azure Security baseline is available for Azure monitor. You can monitor this security baseline and its recommendations using Microsoft Defender for Cloud.
Implementing Azure Monitor in your Organization
When you have plan to use Azure monitor, you need to define strategy. You need to finalize what services and products you are going to monitor, what data you are going to collect and how long. Who are your recipient to get alerts and notification on time based on multiples severity (Critical, Error, Warning). Who need access on azure monitor. What kind of reports you need on daily, weekly and monthly basis. When you are monitoring, specific regulation and compliance need to follow based on company security standard, and compliance.
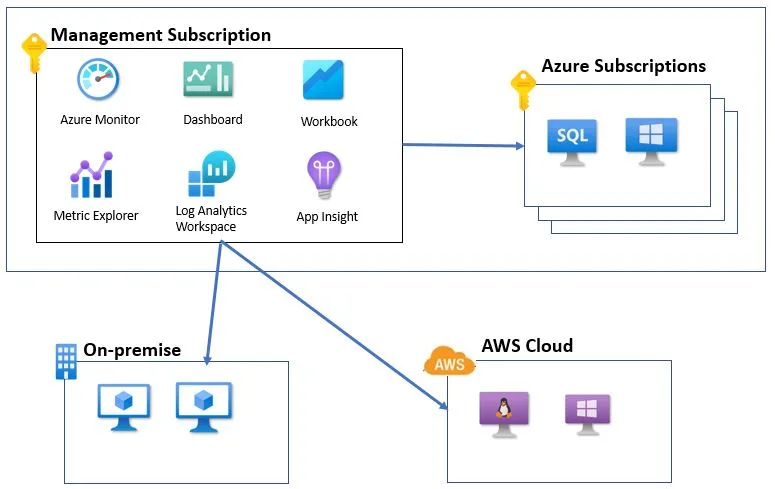
When you are working in enterprise company, you must have multiple subscriptions and resource to be monitored. It is best practice to have single azure monitor service being shared with multiple subscriptions and workload outside azure to collect all data at one place and check status from single pan of glass.
To bring resources of third party clouds under Azure monitoring data plan, you can use either Azure Arc service or else directly install log analytics agent in it. Following diagram depicts that.
If you want to understand Azure Arc service in details, you can refer my previous blog on it https://multicloudsagar.com/azure-arc-enabled-servers/
Important Points to be noted
- OS diagnostic is not supported for all OS hence need to check before enabling it
- Allow Microsoft application insights domain URLs for telemetry and 20.49.111.32/29 and 13.73.253.112/29 IP address range for collecting live metric while enabling application insights
- Application Insights data is retained for 90 days without any charge
- Charges are applicable for data ingestion, retention and export of the data in log analytics workspace but no charges for querying
- No charges for standard metric but charges are applicable for collecting custom metrics
- Metrics are retained in Azure for a 93-day period at no charge, beyond 93 days it can be routed to storage account and respective charges will applicable
- Metrics are retained in Azure for a 93-day period at no charge, beyond 93 days it can be routed to storage account and respective charges will applicable
- To retain activity log data beyond the 90-day period, activity log data can be routed to a storage account or event hub & corresponding charges will apply for storage and event hub, respectively
- Activity logs alert is limited to 100 rules per subscription are free, later chargeable
- 10 alerts for monitored metrics are free, later chargeable
- Under Notification category, 1000 emails are free, later chargeable
- Data transfer charges are applicable between two regions and availability zones.
Above info will give insights of Azure Monitor services and you can implement Azure monitor successfully.
Thanks for watching and keep learning with #MultiCloudSagar